All numbers and rates pertain to place of residence (not occurrence).
If an Age group, Race, Sex, Ethnicity or Education Level are chosen, all rates/percentages include only the choices in both the numerator and denominator.
This Mapping Tool contains ER-Inpatient Visits data for Drug Overdoses generally, and Opioid subsets specifically.
The categories are not mutually exclusive and as follows:
A) DRUG OVERDOSES: ER visit or hospitalization involving any
drug overdose (caused by acute poisoning only. Excludes alcohol). May
include any over-the-counter, prescription, or illicit drug.
Specifically:
Any mention of ICD-10CM codes: T36-T50 AND
6th character: 1-4, and a 7th character of A or missing
OR
5th character: 1-4 where ICD-10CM is T36.9, T37.9, T39.9,
T41.4, T42.7, T43.9, T45.9, T47.9, and T49.9, and a 7th character of A
or missing.
B) ALL OPIOIDS SUBSET: ER visit or hospitalization involving
any opioid overdose. Includes prescription opioid pain relievers (e.g.,
hydrocodone, oxycodone, and morphine), opioids used to treat addiction
(e.g., methadone), as well as heroin, opium, and synthetic opioids
(e.g., tramadol and fentanyl that may be prescription or
illicitly-manufactured). Specifically:
Any mention of ICD-10CM codes: T40.0X, T40.1X, T40.2X, T40.3X, T40.4X (discontinued 9/30/20), T40.41, T40.42, T40.49 (previous 3 codes effective 10/1/20), T40.60, T40.69 AND
6th character: 1-4, and a 7th character of A or missing.
C) HEROIN: ER visit or hospitalization involving a heroin overdose. Specifically:
Any mention of ICD-10CM code: T40.1X AND
6th character: 1-4, and a 7th character of A or missing.
D) FENTANYL: ER visit or hospitalization involving a fentanyl overdose. Specifically:
Any mention of ICD-10CM code: T40.41 AND
6th character: 1-4, and a 7th character of A or missing.
Note: ER visits and hospitalizations may represent multiple visits by the same individual. Also, figures are split roughly 61% ER, and 39% Hospital Discharge. Overall, ~1% were discharged dead (based on 2017-2019 data).
All numbers and rates pertain to the place of residence (not occurrence).
Maps are used to emphasize the spatial distribution of one or more geographic attributes or variables. This site generates choropleth maps as thematic maps in which the geographies are shaded different colors to represent different magnitudes of a variable.
The map projection is Lambert Conformal Conic.
Not Reportable
At the County level or higher rates (and percents) based on 1-4 events are not reported due to statistical reliability reasons. At sub-county level (Census Tract or County Commission District), rates and percents based on 0-4 are not reported. This assures confidentiality.
Trendable Maps
Trendable maps are a series of choropleth maps showing change in spatial
distribution of data in a selected area over selected period of time. Trendable maps share the same
data class breaks which allows easy comparison between each map in the series.
Mapping Units:
County to create a map of a selected geography: counties, Public Health District(s) or Perinatal Region(s); or
Public Health District to create a map of the state by the 18 Public Health Districts; or
Perinatal Region to create a map of the state by the 6 Perinatal Regions.
Visible Layers:
Census Tracts 2020
Census Tracts are small, relatively permanent statistical subdivisions of a county or equivalent entity that are updated by local
participants prior to each decennial census.
Census tracts generally have a population size between 1,200 and 8,000 people. A census tract usually covers a contiguous area;
however, the spatial size of census tracts varies widely depending on the density of settlement. Census tract boundaries are
delineated with the intention of being maintained over a long time so that statistical comparisons can be made from census to census.
Census tracts occasionally are split due to population growth or merged as a result of substantial population decline.
Census tract boundaries generally follow visible and identifiable features. They may follow nonvisible legal boundaries, such as
minor civil division (MCD) or incorporated place boundaries in some states and situations, to allow for census-tract-to-governmental-unit
relationships where the governmental boundaries tend to remain unchanged between censuses. State and county boundaries always are
census tract boundaries in the standard census geographic hierarchy.
Reference Source: U.S. Commerce Department, United States Census Bureau, February 2022.
Cities/Towns
A mix of both incorporated places (legal entities) and census designated places or CDPs (statistical entities). An incorporated place is established to provide governmental functions for a concentration of people. Places always nest within a state, but may extend across county and county subdivision boundaries. An incorporated place usually is a city, town, village, or borough, but can have other legal descriptions. CDPs are delineated to provide data for settled concentrations of population that are identifiable by name, but are not legally incorporated under the laws of the state in which they are located. Click on city/town name to highlight the boundary. Reference Source: U.S. Census, 2020.
County Commission Districts
For more information, see http://www.accg.org/. The districts were established in 2014, and were obtained from the Association of County Commissioners of Georgia (ACCG). Further processing was performed by the Office of Health Indicators for Planning (OHIP) of the Georgia Department of Public Health. History and role: In 1868 the state began creating the position of county commissioner to administer the general operations of the county. Today every county has a commissioner; many have a board of commissioners (BOC). As part of general county operations, the BOC must finance county programs. A BOC has the power to adopt ordinances, resolutions, or regulations relating to county property, county affairs, and the operation of local government (http://www.georgiaencyclopedia.org/nge/Article.jsp?id=h-589 ).
GA House Districts
Electoral districts from which State Representatives are elected. The Georgia Constitution requires not less than 180 Representatives apportioned by population from representative districts. Layer Source: https://www.legis.ga.gov/, Adopted 2023 – Effective for 2024 Elections.
GA Senate Districts
Electoral districts from which State Senators are elected. The Georgia Constitution limits the number to not more than 56 single member districts. Senate districts are apportioned based on population. Layer Source: https://www.legis.ga.gov/, Adopted 2023 – Effective for 2024 Elections.
Hospitals
Hospitals are inpatient medical facilities in Georgia. Click on the symbol to get the name. Updated 6.23.2025.
Interstates
Interstates are the freeways that are part of the Interstate Highway System in Georgia. The Interstate Highway System connects major cities within the United States. Click on the line to get the Interstate number. Layer Source: Esri, March 1, 2012.
Major Roads
Major roads are a combination of both federal and state highways connecting cities and towns. Click on the line to get the route number. Layer Source: Esri, March 1, 2012.
Perinatal Regions
The Perinatal Regions were established by the Department of Public Health in cooperation with the six teaching hospitals located in Atlanta, Albany, Augusta, Columbus, Macon and Savannah. The Regions reflect the hospital referral patterns for high risk pregnant women and newborns. Each of the six hospitals has a Regional Perinatal Center which has contracts with the state and receives funding to care for high risk pregnant women and infants as well as to train staff from other hospitals in perinatal care especially for high risk patients. Reference Source: Georgia Department of Public Health, March 2005.
Established by the U.S. Postal Service for distribution of mail. Zip codes do not generally respect political boundaries or census areas such as tracts. Zip codes usually do not have clearly identifiable boundaries, often serve a continually changing area, are changed periodically to meet postal requirements, and do not cover all land area in the U.S. Layer Source: Esri, June 1, 2020.
Base Layers:
Base layers are background information to provide contextual references for local-level maps. They are especially suited for tract-level maps and give real-world reference to maps you create in OASIS. There are six toggle-able (on/off) base layers:
Aerial Photograph
World Imagery provides one meter or better satellite and aerial imagery (ESRI).
Simple Street
Light Gray Canvas provides a neutral background with minimal colors, labels, and features allowing the choropleth maps to come to the foreground (ESRI).
Socioeconomic (SES) Vulnerability
Socioeconomic (SES) Vulnerability refers to the socioeconomic status domain/subset of the CDC’s Social Vulnerability Index (SVI) 2020. Socioeconomic vulnerability ranks census tracts within Georgia on 5 factors: below 150% poverty, unemployed, housing cost burden, no high school diploma, and no health insurance. Percentile ranking values range from 0 to 1, with higher values indicating greater vulnerability/lower socioeconomic status. Quintiles of the percentile rankings were used to create class breaks (Very Low, Low, Average, High and Very High SES Vulnerability). Keep in mind that “Very Low” SES Vulnerability equates to a High SES status. For more information Please visit CDC website.
For data dictionary click here.
Street and Place Names
National Geographic World Map, developed by National Geographic and Esri, is designed to be used as a general reference map for informational and educational purposes (ESRI).
Street Map
World Street Map includes highways, major roads, minor roads, one-way arrow indicators, railways, water features, cities, parks, landmarks, building footprints, and administrative boundaries, overlaid on shaded relief for added context (ESRI).
Street Topographical
World Topo Map includes administrative boundaries, cities, water features, physiographic features, parks, landmarks, highways, roads, railways, and airports overlaid on land cover and shaded relief imagery for added context (ESRI).
Data Classification Methods:
Quantiles: splits the data into equal-sized groups, for example dividing all 159 counties into 5 groups from smallest number to largest. Roughly 32 counties will be in each group.
Natural Breaks (Jenks): looks for clusters in the data and groups similar values together, so each group has numbers that are more alike. For example, if mapping counts by county, Fulton may stand out by itself and be the only county in its group.
Which to use? That depends on what questions you’re trying to answer, and the distribution of the underlying data. Quantiles usually produces more compelling maps when using the Trendable Maps feature on OASIS. Jenks is useful to highlight natural patterns in the data and outliers. In sum:
Quantiles: Showing Overall Spatial Patterns Across Areas
Good for showing distribution evenness or making comparisons between groups.
Pros: Simple, balanced categories.
Cons: Can place very different values in the same class if data are skewed.
Natural Breaks (Jenks): Highlighting Areas With Distinctly High or Low Values
Best when data has uneven distribution or natural groupings.
Pros: Highlights natural patterns in the data.
Cons: Uneven class sizes; harder to interpret or compare across maps.
Definitions:
Age
Ages are presented by Detailed Age Groups, Lifestages and Single Year of Age which is created by the Department of Public Health, OHIP. Also, note that selecting "all ages" will supercede any start and end age selection. Uncheck "all ages" to make an age-specific selection.
Age-Adjusted Rates
A weighted average of the age-specific rates, where the weights are the proportions of persons in the corresponding age groups of a standard population. The calculation of an Age-Adjusted Rate uses the year 2000 U.S. standard million. Benefit: Controls for differences in age structure so that observed differences in rates across areas such as counties are not due solely to differences in the proportion of people in different age groups in different areas.
Rates are per 100,000 population.
Data Classes
Also referred to as "class breaks" or
groupings of data.
ER Visits
The number of emergency room visits to non-Federal acute care inpatient facilities. Only ER Visits of Georgia residents who were seen in a Georgia facility are included. Persons can be counted more than once if readmitted. Visits include people both living and who have died, but not those admitted as an inpatient to a hospital. (ER data and Discharge data are mutually exclusive). Since the number and rate are derived only from ER visits, they do not include all existing cases (prevalence) or new cases (incidence) among residents of Georgia. ER Visits are reported by date of discharge, not admitting date.
ER Visit Rate
Formula = [Number of ER visits / Population] * 100,000.
ER-Inpatient Visits
The number of ER Visits and Hospital Discharges from non-Federal, acute-care, inpatient facilities. Only ER Visits and Hospital Discharges of Georgia residents who were seen in a Georgia facility are included.
Patients can be counted more than once if readmitted. Patients who were admitted through the ER but subsequently admitted as an inpatient are counted only once. (Discharge data and ER data are mutually exclusive).
ER Visits and Hospital Discharges include patients discharged living or dead.
Since the number and rate reflect only ER Visits/Hospital Discharges, they do not include all existing cases (prevalence) or new cases (incidence) among residents of Georgia. ER-Inpatient Visits are reported by date of discharge, not admitting date.
ER-Inpatient Visit Rate
Formula = [Number of ER-Inpatient visits / Population] * 100,000.
Ethnicity
Hispanic or Latino includes persons of Mexican, Puerto Rican, Cuban, South or Central American, or other Spanish culture or origin, regardless of race. Non-Hispanic + Hispanic may not equal the total number of events due to persons of unknown ethnicity.
Inpatient Visits
The number of inpatients discharged from non-Federal acute-care inpatient facilities. Only discharges of Georgia residents who were seen in a Georgia facility are included. Persons can be counted more than once if readmitted. Discharges include people both living and who have died, and those initially seen in an ER and were admitted as an inpatient. (Discharge data and ER data are mutually exclusive). Since the number and rate are reflect only hospitalizations, they do not include all existing cases (prevalence) or new cases (incidence) among residents of Georgia. Discharges are reported by date of discharge, not admitting date.
Inpatient Visit Rate
Formula = [Number of Inpatient visits / Population] * 100,000.
International Classification of Diseases, 10th Revision, (ICD-10)
An alphanumeric coding scheme that replaces ICD-9, and used for mortality data since 1999. ICD-10 codes were developed by the World Health Organization Collaborating Centres for Classification of Diseases.
Lifestages
An age year grouping methodology based upon predictable mortality. Georgia uses the following Lifestages: <1 Infancy, 1-4 Early Childhood, 5-12 Later Childhood, 13-19 Adolescence, 20-29 Early Adulthood, 30-44 Young Adulthood, 45-59 Middle Adulthood, 60-74 Late Adulthood, and 75+ Older Adulthood. The highest value for age is 120 years.
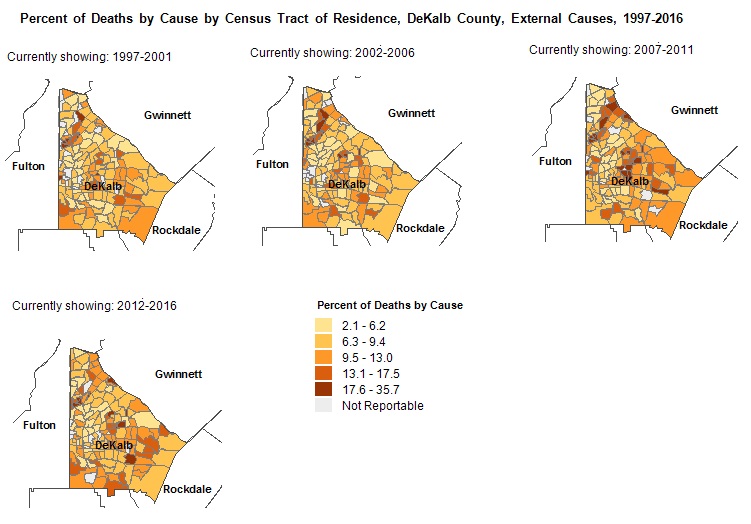
Formula = [Number of cause-specific deaths in the selected geography(ies) / Number of deaths in the selected geography(ies)] * 100
Payor
Payor is the primary entity responsible for payment of services. Values for
Payor include:
Medicaid, based on Title XIX of the Social Security Act, is a Federal-State
matching entitlement program that pays for medical assistance for certain
vulnerable and needy individuals and families with low incomes and resources;
PeachCare for Kids (Georgia's State Child Health Insurance Program (SCHIP)) is
a program that provides comprehensive health care insurance for children
through the age of 18 who do not qualify for Medicaid and live in households
with incomes at or below the federal poverty level;
Medicare is a health insurance program for people age 65 or older, some
disabled people under age 65, and people of all ages with End-Stage Renal
Disease (permanent kidney failure treated with dialysis or a transplant);
Private Insurance includes Blue Cross / Blue Shield, HMO/Managed Care,
Commercial Insurance, Other non-specified Managed Care, PPO (Preferred Provider
Organization), POS (Point of Service Provider),State Health Benefit Plan
(SHBP); and
Self Pay includes patients with no proof of insurance, patients filing their
own insurance claims, patients paying their own bills, Hill-Burton cases,
charity cases, etc.; and
Other (All other plans)
Unknown Payor
Race
Per the Federal Office of Management and Budget, Directive 15 (1997),
White is a person having origins in any of the original peoples of Europe, the Middle East or North Africa;
Black or African-American is a person having origins in any of the black racial groups of Africa;
Asian is a person having origins in any of the original peoples of the Far East, Southeast Asia, or the Indian subcontinent including for example, Cambodia, China, India, Japan, Korea, Malaysia, Pakistan, the Philippine Islands, Thailand and Vietnam;
American Indian/Alaska Native is a person having origins in any of the original peoples of North and South America (including Central America), and who maintains tribal affiliation or community attachment;
Native Hawaiian or Other Pacific Islander is a person having origins in any of the original peoples of Hawaii, Guam, Samoa, or other Pacific Islands;
Multiracial is a person declaring 2 or more of these races.
Socioeconomic (SES) Vulnerability
Socioeconomic (SES) Vulnerability refers to the socioeconomic status domain/subset of the CDC’s Social Vulnerability Index (SVI) 2020. Socioeconomic vulnerability ranks census tracts within Georgia on 5 factors: below 150% poverty, unemployed, housing cost burden, no high school diploma, and no health insurance. Percentile ranking values range from 0 to 1, with higher values indicating greater vulnerability/lower socioeconomic status. Quintiles of the percentile rankings were used to create class breaks (Very Low, Low, Average, High and Very High SES Vulnerability). Keep in mind that “Very Low” SES Vulnerability equates to a High SES status. For more information Please visit CDC website.
For data dictionary click here.
Navigation Tools
Zoom
Use scroll wheel; or Shift+click and drag mouse to draw zoom area; or use + - buttons.
Full Extent: Select this button to see the entire map.
Pan
Click and hold mouse.
Print Map: Click on this button to get a printable copy of the
map in PNG format as it appears at the moment. Disable any pop-up blockers. Right click on the preview and you can choose to save, copy or print the preview. The preview can also be dragged and dropped to a folder or desktop.