- Confidentiality rule:
- Numbers based on 0-4 events are classified as a separate static class when a sub-county level geography (Census Tract or County Commission District) is chosen. This is done to assure confidentiality.
- Not Reportable
- At the County level or higher rates (and percents) based on 1-4 events are not reported due to statistical reliability reasons. At sub-county level (Census Tract or County Commission District), rates and percents based on 0-4 are not reported. This assures confidentiality.
- Trendable Maps
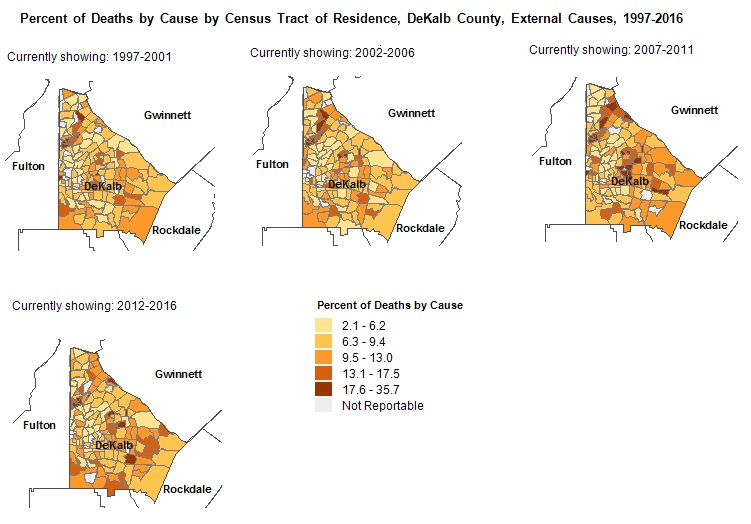
- Trendable maps are a series of choropleth maps showing change in spatial distribution of data in a selected area over selected period of time. Trendable maps share the same data class breaks which allows easy comparison between each map in the series.
Mapping Units:
- County to create a map of a selected geography: counties, Public Health District(s) or Perinatal Region(s); or
- Public Health District to create a map of the state by the 18 Public Health Districts; or
- Perinatal Region to create a map of the state by the 6 Perinatal Regions; orĀĀĀ
- County Commission District or Census Tract to create a map of a selected geography: counties, Public Health District(s) or Perinatal Region(s)
Visible Layers:
- Census Tracts 2020
- Census Tracts are small, relatively permanent statistical subdivisions of a county or equivalent entity that are updated by local participants prior to each decennial census.
- Census tracts generally have a population size between 1,200 and 8,000 people. A census tract usually covers a contiguous area; however, the spatial size of census tracts varies widely depending on the density of settlement. Census tract boundaries are delineated with the intention of being maintained over a long time so that statistical comparisons can be made from census to census. Census tracts occasionally are split due to population growth or merged as a result of substantial population decline.
- Census tract boundaries generally follow visible and identifiable features. They may follow nonvisible legal boundaries, such as minor civil division (MCD) or incorporated place boundaries in some states and situations, to allow for census-tract-to-governmental-unit relationships where the governmental boundaries tend to remain unchanged between censuses. State and county boundaries always are census tract boundaries in the standard census geographic hierarchy. Reference Source: U.S. Commerce Department, United States Census Bureau, February 2022.
- Cities/Towns
- A mix of both incorporated places (legal entities) and census designated places or CDPs (statistical entities). An incorporated place is established to provide governmental functions for a concentration of people. Places always nest within a state, but may extend across county and county subdivision boundaries. An incorporated place usually is a city, town, village, or borough, but can have other legal descriptions. CDPs are delineated to provide data for settled concentrations of population that are identifiable by name, but are not legally incorporated under the laws of the state in which they are located. Click on city/town name to highlight the boundary. Reference Source: U.S. Census, 2020.
- County Commission Districts
- For more information, see http://www.accg.org/. The districts were established in 2014, and were obtained from the Association of County Commissioners of Georgia (ACCG). Further processing was performed by the Office of Health Indicators for Planning (OHIP) of the Georgia Department of Public Health. History and role: In 1868 the state began creating the position of county commissioner to administer the general operations of the county. Today every county has a commissioner; many have a board of commissioners (BOC). As part of general county operations, the BOC must finance county programs. A BOC has the power to adopt ordinances, resolutions, or regulations relating to county property, county affairs, and the operation of local government (http://www.georgiaencyclopedia.org/nge/Article.jsp?id=h-589 ).
- GA House Districts
- Electoral districts from which State Representatives are elected. The Georgia Constitution requires not less than 180 Representatives apportioned by population from representative districts. Layer Source: https://www.legis.ga.gov/, Adopted 2021 ¢ Effective for 2022 Elections.
- GA Senate Districts
- Electoral districts from which State Senators are elected. The Georgia Constitution limits the number to not more than 56 single member districts. Senate districts are apportioned based on population. Layer Source: https://www.legis.ga.gov/, Adopted 2021 ¢ Effective for 2022 Elections.
- Hospitals
- Hospitals are the non-Federal acute-care inpatient medical facilities in Georgia. Click on the symbol to get the name. Reference Source: Georgia Hospital Association, 2021.
- Interstates
- Interstates are the freeways that are part of the Interstate Highway System in Georgia. The Interstate Highway System connects major cities within the United States. Click on the line to get the Interstate number. Layer Source: Esri, March 1, 2012.
- Major Roads
- Major roads are a combination of both federal and state highways connecting cities and towns. Click on the line to get the route number. Layer Source: Esri, March 1, 2012.
- Perinatal Regions
- The Perinatal Regions were established by the Department of Public Health in cooperation with the six teaching hospitals located in Atlanta, Albany, Augusta, Columbus, Macon and Savannah. The Regions reflect the hospital referral patterns for high risk pregnant women and newborns Each of the six hospitals has a Regional Perinatal Center which has contracts with the state and receives funding to care for high risk pregnant women and infants as well as to train staff from other hospitals in perinatal care especially for high risk patients. Reference Source: Georgia Department of Public Health, March 2005.
- ZIP Code
- Established by the U.S. Postal Service for distribution of mail. Zip codes do not generally respect political boundaries or census areas such as tracts. Zip codes usually do not have clearly identifiable boundaries, often serve a continually changing area, are changed periodically to meet postal requirements, and do not cover all land area in the U.S. Layer Source: Esri, June 1, 2020.
Base Layers:
- Base layers are background information to provide contextual references for local-level maps. They are especially suited for tract-level maps and give real-world reference to maps you create in OASIS. There are three toggle-able (on/off) base layers:
- Demographic Clusters
- Demographic Clusters refer to the socioeconomic status classifications created by OHIP, and are at the census block-group level. More information here: https://oasis.state.ga.us/gis/demographiccluster/DemoClusters2011.htm
- Aerial Photography
- Aerial Photography refers to ESRI's World Imagery.
- Socioeconomic (SES) Vulnerability
- Socioeconomic (SES) Vulnerability refers to the socioeconomic status domain/subset of the CDCÆs Social Vulnerability Index (SVI) 2020. Socioeconomic vulnerability ranks census tracts within Georgia on 5 factors: below 150% poverty, unemployed, housing cost burden, no high school diploma, and no health insurance. Percentile ranking values range from 0 to 1, with higher values indicating greater vulnerability/lower socioeconomic status. Quintiles of the percentile rankings were used to create class breaks (Very Low, Low, Average, High and Very High SES Vulnerability). Keep in mind that ōVery Lowö SES Vulnerability equates to a High SES status. For more information see https://www.atsdr.cdc.gov/placeandhealth/svi/index.html. For data dictionary click here.
- Street Map
- Street Map refers to ESRI's World Street Map with street-level data for North America.
Data Classification Methods:
- Natural Breaks (Jenks)
- This method minimizes within-class variance and maximizes between-class variance in an iterative series of calculations. This method seeks to partition data into classes based on natural groups in the data distribution. Natural breaks occur in the histogram at the low points of valleys. Breaks are assigned in the order of the size of the valleys, with the largest valley being assigned the first natural break.
- George F. Jenks is considered a pioneer in GIS educational programs. Through an award from the Fund for Advancement of Science, Jenks identified four key objectives for cartographic training. Robert McMaster and Susanna McMaster; A History of Twentieth-Century American Academic Cartography
- Source: Brewer and Pickle. Evaluation of Methods for Classifying Epidemiological Data on Choropleth Maps in a Series. Annals of the Association of American Geographers, 92(4), 2002, pp. 662-681.
- Quantiles
-
- Data values for each enumeration unit (e.g. county or census tract) are ranked from lowest to highest.
- The total number of values is divided by the number of classes specified by the user to determine how many values each class will contain. The object is to obtain a roughly equal number of data values within each class. For example, if you have 100 census tracts and the tract data values are to be classed into 5 classes, each class will have 20 values (100/5 = 20).
- In some cases, an equal number of values will not be placed into each class. For instance, if there are an odd number of enumeration units some classes will have a larger number of data values than others. If data values for the 159 counties of Georgia are divided into 4 classes, then some classes might have 39 data values while others have 40. In addition, identical data values are maintained within the same classes. Continuing the Georgia county example, if 45 of the lowest data values are 0, then the lowest class will have 45 data values all with a value of 0.
- Quantiles classification is one of the simplest methods of classification and is easy to understand and interpret.
- Classes are usually centered on the median, a measure of central tendency, and "they group enumeration units above and below the median into classes with equal frequencies regardless of their values." This makes maps easier to compare with one another.
- Many health-related measures are distributed normally (i.e. a large number of values falling near the middle of the data range with a smaller number of values on the low and high ends of the data range) making quantiles classification a logical classification method.
Definitions:
- Births Breastfed and Percent Births Breastfed
- The number of live births reported to be breastfed upon discharge, per 100 total live births. Formula = [Number of live births breastfed / Number of live births] * 100. Records with unknown values for this selected measure are excluded from the denominator.
- Birth Rate
- The number of live births occurring to females in an age group per 1,000 females in the same age group. Formula = [Number of Live Births in an age group / Female population in same age group] * 1,000. If no age chosen, then birth rate will equal All Live Births / Female Population 10-55 years of age * 1,000 (which will differ from the General Fertility Rate).
- Birthweight
- Low Birthweight - A live birth with a birthweight of less than 2,500 grams (5lbs. 8oz.). Low Birthweight Rate (Percentage) - Total number of live births weighing less than 2,500 grams born during a specified time period (usually one year) per 100 total live births. Formula = [Total Number of Live Births under 2,500 grams / Total Number of Live Births] * 100. Select both <1,500 and 1,500-2,499 to obtain Low Birthweight.
- Very Low Birthweight - A live birth with a birthweight of less than 1,500 grams (3lbs. 5oz.). Very Low Birthweight Rate (Percentage) - Total number of live births weighing less than 1,500 grams during a specified time period (usually one year) per 100 total live births. Formula = [Total Number of Live Births under 1,500 grams / Total Number Live Births] * 100.
- Data Classes
- Also referred to as "class breaks" or groupings of data.
- Educational Level
- The last grade of formal education completed. A sample calculation is Percentage of Live Births to Females with Less than High School Education - The total number of live births to females with less than a high school education, per 100 total live births. Formula = [Total Number of Live Births to Females with Less than High School Education / Total Number of Live Births] * 100.
- Ethnicity
- Hispanic or Latino includes persons of Mexican, Puerto Rican, Cuban, South or Central American, or other Spanish culture or origin, regardless of race. Non-Hispanic + Hispanic may not equal the total number of events due to persons of unknown ethnicity.
- First Births & Percent First Births
-
The number of births that are the first birth to the women.
Formula = [Number of first births]/[Number of live births]*100 - Intrauterine Growth Restriction (IUGR) / Small for Gestational Age (SGA)
- Note that selecting Percent of Births where Gestational Age was Term, and Low Birthweight (<2,500), creates a surrogate measure of IUGR or SGA. IUGR can indicate that the mother's nutritional status during pregnancy was less than optimal.
- General Fertility Rate (GFR)
- The number of live births that occur per 1,000 females ages 15-44 years of age. Formula = [Number of live births / Female population 15-44 years of age] * 1,000. If a race, age, sex or ethnicity is chosen, both the numerator and denominator are filtered by that selection. Rates that use Census Population Estimates in the denominator are unable to be calculated when the selected population is Unknown.
- Kotelchuck Index
- An index of adequacy of prenatal care based upon 1) month of entry, 2) number of prenatal visits and 3) gestational age of infant at birth. Uses the American College of Obstetricians and Gynecologists (ACOG) standards for number of visits.
- Note regarding 2007-2012 data: The percentage of missing values for this indicator was greater than 20%, so it is not available for these years .
- Live Birth
- The complete expulsion or extraction of a product of conception from its mother, irrespective of the duration of the pregnancy, which after such separation, breathes or shows any other evidence of life, such as beating of the heart, pulsation of the umbilical cord, or definite movement of voluntary muscles, whether or not the umbilical cord has been cut or the placenta is attached.
- Month Mother Began Prenatal Care
- A sample calculation is ´Late prenatal care,´ considered to be care received after the second trimester (per National Center for Health Statistics). Formula = [Number of live births where the mother received prenatal care after 2nd trimester, or not at all / Number of live births] * 100.
- Note regarding 2007-2012 data: The percentage of missing values for this indicator was greater than 20%, so it is not available for 2007-2012.
- Number of Prenatal Care Visits
- A sample calculation is Percent of Live Births with Less Than 5 Prenatal Care Visits - Total number of births where mother had less than 5 prenatal care visits, per 100 total live births. Formula = [Total Number of Live Births with less than 5 prenatal care visits / Total Number of Live Births] * 100.
- Note regarding 2008-2012 data: The percentage of missing values for this indicator was greater than 20%, so it is not available for 2008-2012.
- Percent of Birth
- The number of live births to females with certain measures (e.g., gestational age, birthweight, educational level or, marital status), per 100 total live births. Formula = [Number of live births to females with < 12th grade education (for example) / Number of live births] * 100. Records with unknown values for this selected measure are excluded from the numerator and denominator. If a race, age, sex, education or ethnicity is chosen, both the numerator and denominator are filtered by that selection.
- Repeat Births & Percent Repeat Births
-
The number of births to women who previously had at least one birth.
Formula = [Number of repeat births]/[Number of births]*100 - Race
-
Per the Federal Office of Management and Budget, Directive 15 (1997),
- White is a person having origins in any of the original peoples of Europe, the Middle East or North Africa;
- Black or African-American is a person having origins in any of the black racial groups of Africa;
- Asian is a person having origins in any of the original peoples of the Far East, Southeast Asia, or the Indian subcontinent including for example, Cambodia, China, India, Japan, Korea, Malaysia, Pakistan, the Philippine Islands, Thailand and Vietnam;
- American Indian/Alaska Native is a person having origins in any of the original peoples of North and South America (including Central America), and who maintains tribal affiliation or community attachment;
- Native Hawaiian or Other Pacific Islander is a person having origins in any of the original peoples of Hawaii, Guam, Samoa, or other Pacific Islands;
- Multiracial is a person declaring 2 or more of these races.
- Socioeconomic (SES) Vulnerability
- Socioeconomic (SES) Vulnerability refers to the socioeconomic status domain/subset of the CDCÆs Social Vulnerability Index (SVI) 2020. Socioeconomic vulnerability ranks census tracts within Georgia on 5 factors: below 150% poverty, unemployed, housing cost burden, no high school diploma, and no health insurance. Percentile ranking values range from 0 to 1, with higher values indicating greater vulnerability/lower socioeconomic status. Quintiles of the percentile rankings were used to create class breaks (Very Low, Low, Average, High and Very High SES Vulnerability). Keep in mind that ōVery Lowö SES Vulnerability equates to a High SES status. For more information see https://www.atsdr.cdc.gov/placeandhealth/svi/index.html. For data dictionary click here.
- Weeks of Gestation
- The gestational age of a fetus is the elapsed time since the first day of the last normal menstrual period. Gestational age is expressed in completed weeks. Some specified variations of gestational age are: 1) Very Preterm: 20 - 31 completed weeks of pregnancy, 2) Preterm: 32 to less than 37 completed weeks; 3) Term: From 37 to less than 42 completed weeks; and 4) Post-term: 42 completed weeks or more. Select both Very Preterm (<32 weeks) and Preterm (32-36 weeks) to obtain all premature infants. With the release of 2014 birth data, we have implemented the new national standard for calculating gestational age per NCHS that uses the Obstetric Estimate instead of the LMP-based calculation (National Vital Statistics Reports, Vol. 64, No.5, Measuring Gestational Age in Vital Statistics Data: Transitioning to the Obstetric Estimate. June 1, 2015) . This has the effect of lowering rates of Prematurity by roughly 2 percentage points. Further, we retroactively updated the prematurity numbers and rates back to year 2008 in order to provide some trendable figures. You will therefore notice a marked drop in Prematurity rates from 2007. Formula = [Number of live births with gestational age less than 37 weeks / Number of live births] * 100. If a race, age, sex or ethnicity is chosen, both the numerator and denominator are filtered by that selection.
Map Tools
 |
Zoom In: Select this button and then click on the map to enlarge the map. You can also click down and drag your mouse to define an area to zoom to. |
 |
Zoom Out: Select this button and the click on the map to reduce
the map. The area where you click will be the center of the map. Note: Select the mouse scroll wheel to zoom in or out. |
 |
Full Extent: Select this button to see the entire map. |
 |
Pan: Select this button to move the map around in any given extent. |
 |
Previous Extent: Click on this button to go back to the previous extent. |
 |
Next Extent: Click on this button to go to the next extent (before previous extent) |
 |
Print Map: Click on this button to get a printable copy of the map in PNG format as it appears at the moment. Disable any pop-up blockers. Right click on the preview and you can choose to save, copy or print the preview. The preview can also be dragged and dropped to a folder or desktop. |
V1.15 (2/14/2024)