All numbers and rates pertain to place of residence (not occurrence).

If an Age group, Race, Sex, Ethnicity or Education Level are chosen, all rates/percentages include only the choices in both the numerator and denominator.

Cohort
A group of people sharing a common temporal demographic experience who are observed through time. For example, the birth cohort of 1940 is the people born that year. Another example is school class cohort. In this case, Birth Cohorts are used. This means that in a given cohort year, all fetal deaths and births are accounted for. However any infant deaths that are linked to live births may have occurred in the cohort year or up to one year after. E.g. the 2014 birth cohort will include linked infant deaths that occurred in both 2014 and 2015.
Education
The last grade of formal education completed. A sample calculation is Percentage of Live Births to Females with Less than High School Education - The total number of live births to females with less than a high school education, per 100 total live births. Formula = [Total Number of Live Births to Females with Less than High School Education / Total Number of Live Births] * 100.
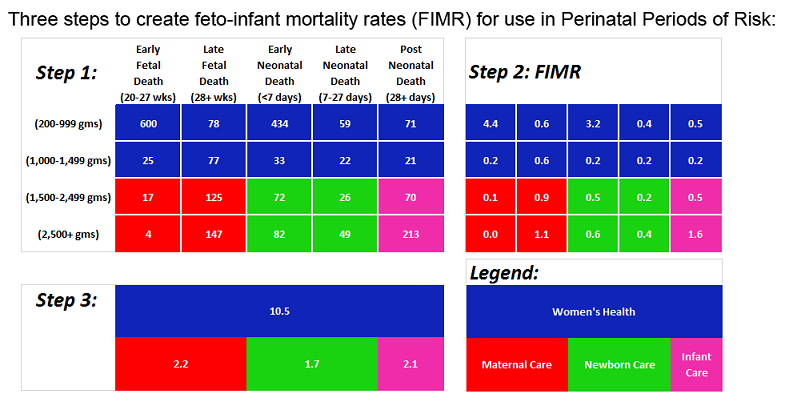
Feto-Infant Mortality Rate (FIMR) and Perinatal Periods of Risk (PPOR)
Feto-infant mortality rate (FIMR) is defined as the number of fetal deaths (>= 20 weeks gestation & 200+ grams) plus the number of infant deaths (200+ grams) divided by the total number of fetal deaths (>= 20 weeks gestation & 200+ grams) plus live births (200+ grams) and expressed as a rate per 1,000. Being a birth cohort measure, infant deaths are linked to live births of a given cohort year. This means that for example, the 2014 Rate of FIMR will have only 2014 Live Births and Fetal Deaths in the denominator, whereas the numerator has Infant Deaths from both 2014 and 2015 that were linked to 2014 Live Births (in addition to 2014 fetal deaths).
PPOR Examples of Suggested Causes Examples of Suggested Interventions
Women's Health Unintended Pregnancy, Poor Nutrition, No Prenatal Care, Substance Abuse/Smoking, First or 4th-or-higher birth, Untreated STD's, < 2 year birth interval. Pre-conceptual, peri-conceptual and early prenatal interventions which affect the mother's health and increase birthweight. Examples include assuring good nutritional status including folic acid intake.
Maternal Care Prenatal Care not matched to need. Prenatal, intra-partum and postpartum services which directly affect the maternal outcome by reducing excessive maternal and fetal mortality and morbidity. Assuring an appropriate match between need and content of prenatal care.
Newborn Care Group B Strep untreated. Intra-partum, early neonatal, and postpartum services which directly affect the newborn outcome by reducing excessive early neonatal mortality and morbidity. These are chiefly biomedical interventions.
Infant Care No Parenting Skills Education, No Immunizations, No breastfeeding, Injury: Falls, burns, etc, Child Abuse / neglect, No Monitoring Growth / Development. Post discharge services which directly affect the infant outcome by reducing excessive post discharge mortality and morbidity. For example, SIDS and injury prevention through health education.
PPOR Methodology
Formula
Women's Health = [Number of Feto-Infant deaths related to Women's Health / (Births 200+ grams + Fetal Deaths >= 20 weeks and 200+ grams)] * 1,000
Maternal Care = [Number of deaths occurring to fetuses related to Maternal Care / (Births 200+ grams + Fetal Deaths >= 20 weeks and 200+ grams)] * 1,000
Newborn Care = [Number of infant deaths related to Newborn Care / (Births 200+ grams + Fetal Deaths >= 20 weeks and 200+ grams)] * 1,000
Infant Care = [Number of infant deaths related to Infant Care / (Births 200+ grams + Fetal Deaths >= 20 weeks and 200+ grams)] * 1,000
Socio-Economic Status (SES) Groups
SES groups commonly used in PPOR: for each Race: 1) 20+ years of age & 13+ years of education, 2) 20+ years of age & <13 years of education, 3) <20 years of age & <13 years of education.
International Classification of Diseases, 9th Revision, Clinical Modification (ICD-9-CM)
A statistical classification system, in use since 1979, that arranges diseases and injuries into groups according to established criteria. It is used to improve comparability of cause of death statistics reported by different governmental entities. Most ICD-9-CM codes are numeric and consist of three, four or five numbers and a description. The codes are revised approximately every 10 years by the World Health Organization and annual updates are published by the Health Care Financing Administration (HCFA), now the Center for Medicare, Medicaid Services.
International Classification of Diseases, 10th Revision, (ICD-10)
An alphanumeric coding scheme that replaces ICD-9, and used for mortality data since 1999. ICD-10 codes were developed by the World Health Organization Collaborating Centres for Classification of Diseases.
Non-Rural
Any county with 50,000 or more total population according to the United States decennial census of 2010 or any future such census (GA Code § 31-6-2 and 31-7-94.1).
Race
Per the Federal Office of Management and Budget, Directive 15 (1997),

Note: Rates for years prior to year 2000 use population estimates for the denominator that adhere to a different Federal standard for race: White, Black, Asian or Other Pacific Islander, American Indian and Alaska Native. So, unlike years 2000 and after, Multiracial is not included. Also, Asian by itself is not available because it was grouped with Pacific Islander (After 1999 Asian is separate from Native Hawaiian or Other Pacific Islander).

Rates using Census Population Estimates in the denominator are not calculated when a selected race is not available in the denominator, or zero.

Nevertheless, selections available in OASIS' Race query box reflect the 1997 Race classifications described above. Most of the numerators used in indicators in Oasis *do* have the year 2000 race selections. Therefore, selections of multiple years that span <2000 and 2000+ will return a *number (count)* for all race selections, but the *rates* may be limited by the change in racial classifications the federal government used as noted above. In these cases you will see NA1 in the output cell (NA1 therefore by definition will only show up in rates for the years before 2000).

In some cases, the numerator's race classification may be more precise, or up to date, than the Census population estimate counterpart used in the denominator. You may find that there are a number of births of a given race for a county/age-group selection, but no count of population estimated for the denominator. In such cases where the race selection was available for both the numerator and the denominator, but the denominator's estimate was zero, you will see a NA2. If the numerator was greater than the denominator, but the denominator was > 0, you will see a NA3 returned.
Rural
Any county having a population of less than 50,000 according to the United States decennial census of 2010 or any future such census (GA Code § 31-6-2 and 31-7-94.1).
Socioeconomic (SES) Vulnerability
Socioeconomic (SES) Vulnerability refers to the socioeconomic status domain/subset of the CDC’s Social Vulnerability Index (SVI) 2020. Socioeconomic vulnerability ranks census tracts within Georgia on 5 factors: below 150% poverty, unemployed, housing cost burden, no high school diploma, and no health insurance. Percentile ranking values range from 0 to 1, with higher values indicating greater vulnerability/lower socioeconomic status. Quintiles of the percentile rankings were used to create class breaks (Very Low, Low, Average, High and Very High SES Vulnerability). Keep in mind that “Very Low” SES Vulnerability equates to a High SES status. For more information see https://www.atsdr.cdc.gov/placeandhealth/svi/index.html. For data dictionary click here.

V2.12 (1/4/2024)